How the Distribution Centre Decides What Is on Your Shelf
An execution-ready, brand-agnostic guide to supermarket distribution-centre operations — for franchisees, independents, store and area managers, cash-and-carry operators, and family-owned retail. Built for the realities of South African retail: loadshedding, cold-chain risk, cargo crime, and the move to dark stores.
Ambient · chilled · frozen
operations
Generic model
plays
Why the DC Decides Your Shelf
In one line: the building you never see — the distribution centreA centralised warehouse that receives bulk stock from suppliers and redistributes mixed, store-ready loads to retail outlets. (DC) — is the machine that decides whether your shelves are full or empty on a Monday morning. This playbook explains how it works, what it costs, and where it breaks.
Whether you run a franchise supermarket on the KwaZulu-Natal coast, an independent store in a township, or a cash-and-carry serving spaza shops, your business runs on a logistics model most owners never fully see. The shift over the last twenty years has been total: from dozens of supplier trucks fighting for space at your back door, to a handful of mega-warehouses that run twenty-four hours a day and dispatch a single mixed-load truck to your store.
This document tells that story operationally — with a realistic model of how a large DC is sized, staffed, and funded; a synthetic P&L and payback calculation; the systems that move stock and data; and the pain points (loadshedding, cargo crime, rigid delivery windows) that hit your pocket directly. It is deliberately brand-agnostic: no chain names appear anywhere, and all financial figures are clearly labelled illustrative / synthetic so you can recalibrate them to a real client.
✦ Operations Play — Chapter 1
- Map every product on your top-shelf to its source: DC delivery, direct-to-store, or cash-and-carry collection.
- Identify the single category most exposed to a DC outage (usually fresh / chilled) and write a one-page backup plan.
- Walk your receiving bay this week and time how long a mixed-load delivery takes to check in.
From the Back Door to the Mega-Warehouse
The shift: retailers moved from direct store deliveryDirect Store Delivery (DSD): each supplier drives its own truck to each store. High control, high cost, heavy on the back door. (DSD) — where every supplier drove to every store — to centralised distribution, where suppliers drop bulk at one regional hub and a single mixed-load truck serves each store. The chains that moved early won a logistics lead the late movers are still closing.
The old world: when the back door never stopped
Through the 1970s, 80s and into the 90s, the receiving bay was the busiest part of a supermarket. The bread van, the milk truck, the soft-drink truck, the spice rep, the detergent rep — each arrived separately, each wanted a signature, each needed dock space, and each wanted their invoice checked on the spot. Stores held weeks of inventory in large stockrooms and employed receiving staff whose day was spent arguing about short dates and chasing credits for damages.
For independents and franchisees, the real cost was buying power. A single store negotiated alone, and a supplier could quietly give a bigger chain a better deal down the road. Large retailers knew centralisation was more efficient for decades, but major suppliers pushed back hard — they liked controlling the delivery schedule and the direct relationship with each store manager, and they offered their best discounts to retailers who kept delivering store-by-store1.
The turn: central distribution takes over
By the mid-2000s, the decentralised model of the largest chains was bleeding money at scale — costs rising, availability patchy, back-door chaos unsustainable. One major retailer announced a phase-in of centralised distribution, requiring suppliers to drop goods at regional hubs instead of individual stores4. A single company truck would then carry mixed loads to each store.
The flagship hubs that followed set the template for the whole industry:
| Hub characteristic | Illustrative scale | Source / note |
|---|---|---|
| Flagship inland DC footprint | ~50,000 sqm | R600m+ build, ~280+ stores served5 |
| Largest single-roof DC on the continent | ~114,000–123,000 sqm | Consolidates several older DCs67 |
| Truck doors at a mega-DC | 130+ doors | ~20,000 products from ~600 suppliers8 |
| Regional grocery DC network (one group) | 6+ regional DCs | Plus satellites to cut transport cost10 |
✦ Operations Play — Chapter 2
- List which of your lines still arrive direct-to-store vs via DC; DSD lines are your flexibility, DC lines are your volume.
- Estimate the receiving-staff hours you spend per week on DSD invoice checks — that is the cost centralisation removes.
- If you are independent or in a buying group, benchmark your delivered cost vs a franchised peer for one shared SKU.
Inside a Distribution Centre
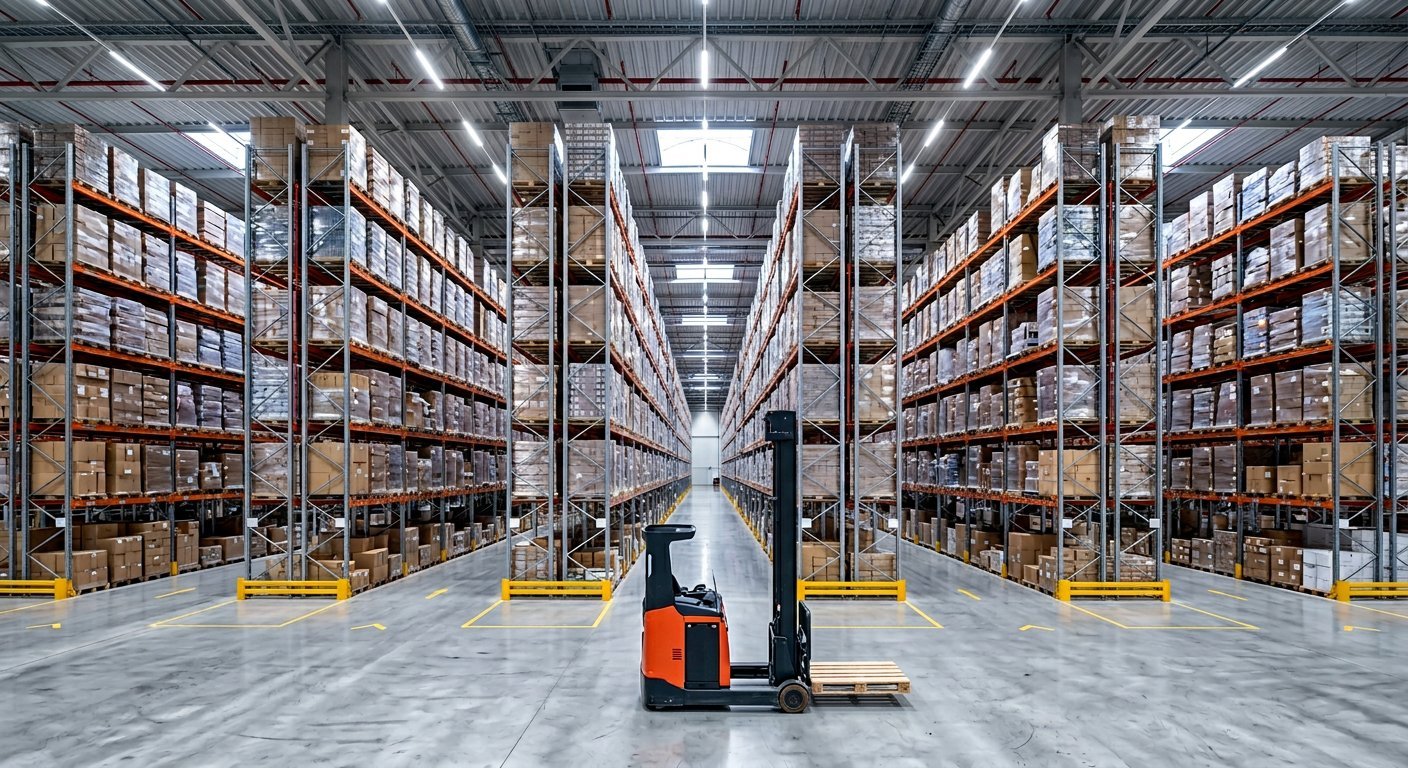
The reality: a major DC runs 20–24 hours a day across multiple shifts, with receiving, put-away, cross-dockCross-docking (flow-through): inbound goods are moved straight from the receiving dock to the outbound dock, with little or no storage in between. Used for fast-moving and fresh lines., voice-guided picking, route-planned dispatch, and a returns/waste stream. Every zone has its own equipment, staff and procedures.
The shift pattern
Most major DCs run three shifts, often continuously. A single mega-DC can employ on the order of 3,000–4,000 people directly, plus indirect contractors7. Typical roles: receiving clerks, put-away teams, pickers, dispatch loaders, forklift and MHEMaterial Handling Equipment: forklifts, reach trucks, pallet jacks, conveyors and automated guided vehicles used to move goods inside the DC. drivers, quality controllers, maintenance, and security.
Receiving — where it all starts
Supplier trucks are checked in at the gate and backed into dozens — sometimes over a hundred — receiving doors. One large inland DC has roughly 260 dock levelers across receiving and dispatch12. The receiving clerk checks the delivery note against the purchase order, scans goods into the WMSWarehouse Management System: the software that controls receiving, put-away, inventory, picking and dispatch — the digital brain of the DC., and flags fresh produce, meat and dairy for quality checks. Clean stock then flows one of two ways:
- Put-away: pallets are stored in racking — in the ambient section, stacked up to six levels high. The system chooses the location to optimise density and FEFOFirst-Expired-First-Out: stock rotation by expiry date (a date-driven version of FIFO) so the oldest-dated goods ship first..
- Flow-through / cross-dock: fast-moving and fresh lines never touch a shelf — they move straight from inbound to outbound dock.
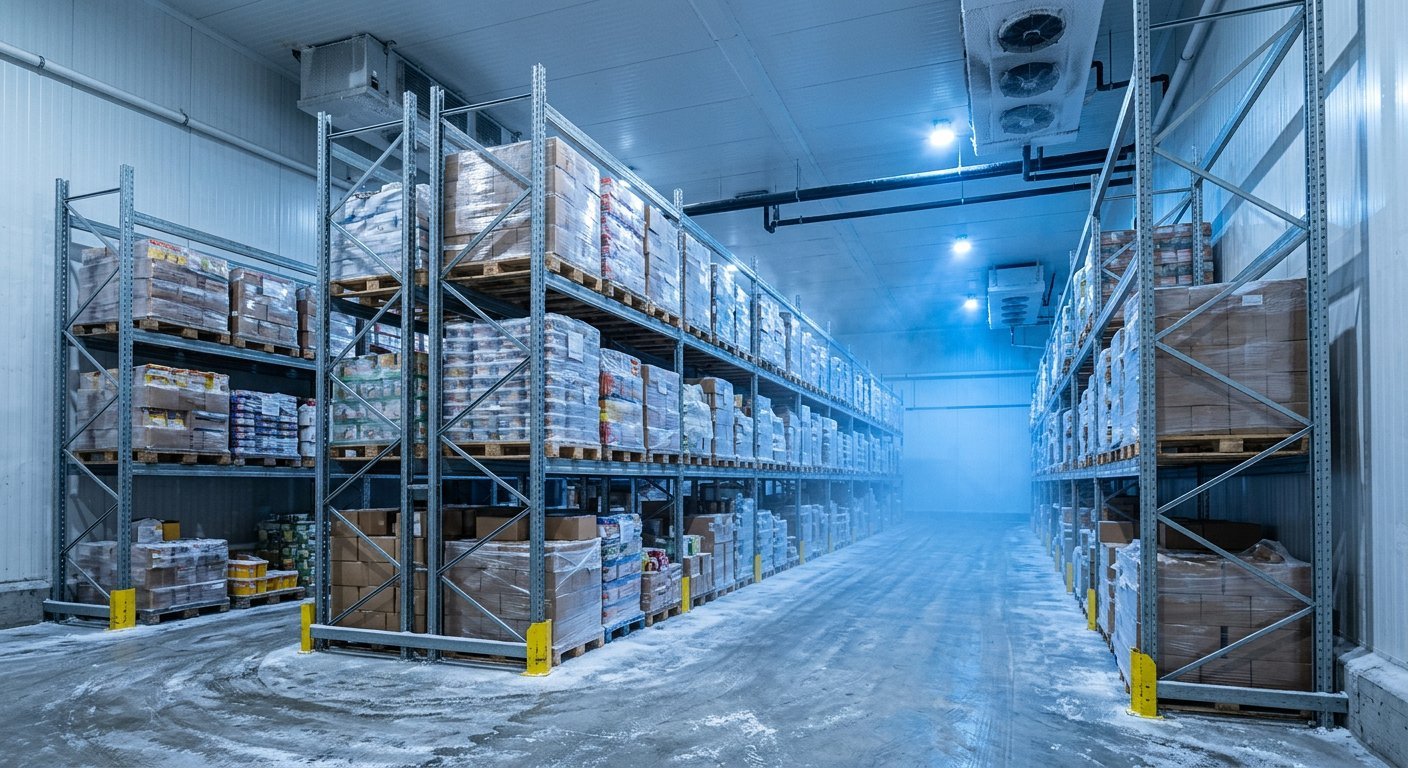
The three temperature zones
A modern DC is split into specialist environments. You cannot move equipment freely between them without a temperature lock or equipment switch.
| Zone | Typical range | Holds | Notes |
|---|---|---|---|
| Ambient | 15–25 °C | Dry groceries, toiletries, cleaning, cans | May include a temperature-controlled sub-zone for heat-sensitive goods7 |
| Chilled | 0–5 °C | Dairy, fresh meat, deli, prepared meals | Speed-critical; every minute outside the chain is risk |
| Frozen | ≤ −18 °C | Ice cream, frozen veg, frozen meat | Most energy-intensive; strict dock-seal discipline |
Picking — getting your order ready
When a store orders, the WMS breaks it into picks. A picker receives instructions through a voice headset — no paper, no shouting — telling them the aisle, bay and case count8. The stock goes onto a pallet or into a tote, is scanned, and moves to dispatch. In leading DCs the floor runs in near-total silence because picking is voice-driven and the trucks are electric8.
Picking methodologies & inventory accuracy
How a DC picks decides how fast and how accurately your store gets its order. There is no single “best” method — the choice depends on order profile, volume, and whether the goods are ambient or temperature-controlled. The four methods you will hear about are:
- Discrete (single-order) picking: one picker walks one order end to end. Simple to train and manage, but wasteful of travel time — common in smaller DCs or for unusual orders.
- Batch picking: one picker collects lines for several orders at once into separate totes, then sorts. Cuts walking dramatically for high-volume, small-line orders.
- Zone picking: the DC is divided into zones (often by temperature or category), and a picker owns one zone; an order is assembled as it passes through. Essential for mixed-load grocery because ambient, chilled and frozen must stay in their own environments.
- Wave picking: orders are grouped into waves released against the shift plan, the truck schedule, and the cut-off times. Wave timing is what gets your order onto the right truck, in the right loading sequence.
Underpinning all of this is inventory accuracy — the percentage of locations where the system’s record matches what is physically on the shelf. Best-in-class DCs run at 99% or better, sustained by cycle countingCycle counting: a continuous, rolling count of a small subset of inventory each day, replacing the disruptive full annual stock-take, so accuracy is maintained year-round. rather than a single annual shutdown stock-take. Low accuracy is the hidden cause of “phantom stockouts” — the system thinks a product is available, the picker arrives at an empty location, and your store ships short. For a store owner, every short ship is a lost sale and another credit note to chase.
Dispatch — loading the trucks
This is the logistics brain. Route-planning software decides which truck carries which stock and in what order it is loaded. The last store on the route is loaded first, so when the truck arrives at the first store, that store’s stock is right at the doors8. A single truck carries a mixed loadA single delivery combining ambient, chilled and frozen product, separated by insulated curtains or compartments so one truck serves a store’s full needs. — frozen, chilled and ambient separated by curtains or compartments.
Returns, recycling and waste
DCs also reverse-flow damaged goods, expired product, recalls and unsold promotional stock to a dedicated returns area for sorting, crediting or destruction. At modern sites every used cardboard box is baled on-site into compact “snakes” and sent to recyclers8.
Example document — DC shift KPI dashboard
Illustrative / synthetic. A real WMS exports these live; this shows the shape of the data a DC manager watches each shift.| KPI | Target | Shift actual | Status |
|---|---|---|---|
| Inbound cases received | 42,000 | 40,180 | ▼ -4% |
| Cases picked | 46,500 | 47,210 | ▲ +2% |
| Pick accuracy | 99.6% | 99.51% | ● on target |
| On-time dispatch % | 98.0% | 96.4% | ▼ risk |
| Chilled-zone temp (avg) | ≤ 4 °C | 3.6 °C | ● ok |
| Dock door utilisation | 85% | 91% | ● ok |
| Damage / shortage rate | ≤ 0.4% | 0.36% | ● ok |
✦ Operations Play — Chapter 3
- Ask your DC/wholesaler for a monthly service report: on-time %, pick accuracy, damage rate — if you can’t see it, you can’t manage it.
- Train receiving staff to record temperature on every chilled/frozen delivery before signing — that record is your credit evidence.
- Pre-stage your receiving area before the delivery window: dock free, cold room space reserved, scanner charged.
The DC Economic Model
Sizing the machine: this chapter gives a granular, brand-agnostic operational model — footprint, throughput, headcount, capex and an operating-cost breakdown — for large DCs serving multiple outlets. All figures are illustrative industry-typical ranges; recalibrate to the client’s actuals.
Facility size, throughput and headcount bands
| Band | Footprint (sqm) | Annual throughput | Headcount | Indicative capex |
|---|---|---|---|---|
| Small / regional | 8,000–15,000 | 6–12m cases/yr | 150–400 | R150–400m |
| Medium / multi-temp | 15,000–40,000 | 15–45m cases/yr | 400–1,200 | R400m–R1.2bn |
| Mega / national hub | 40,000–120,000+ | 50–120m+ cases/yr | 1,500–4,000+ | R1.2bn–R3.5bn+ |
Illustrative operating-cost breakdown
Where a DC’s running cost actually goes. Percentages are typical industry blends for a multi-temperature retail DC; chilled-heavy or automated sites skew differently.
| Cost line | % of opex (typical) | Primary driver |
|---|---|---|
| Labour (direct + supervisory) | 33–38% | Headcount, shifts, wage inflation |
| Transport & fleet | 20–24% | Distance to stores, fuel, tractor-trailer fleet |
| Facility rent / finance | 11–13% | Capex amortisation, lease, land |
| Utilities & energy | 8–10% | Refrigeration, lighting, generator diesel |
| Equipment amortisation & maintenance | 7–9% | Forklifts, racking, conveyors, MHE leases |
| IT / WMS / telecoms | 3–4% | Software licences, voice/data, integration |
| Security & risk | 2–4% | Guards, tracking, escorts, CCTV |
| Other (insurance, waste, consumables) | 4–6% | Packaging, recycling, insurance premiums |
Worked example: unit economics & break-even
Illustrative arithmetic for a medium ambient-leaning DC. Numbers are round-figure placeholders to show the method, not a quote.Take the DC above: it handles 28 million cases a year with R238m of operating cost. That works out to roughly R8.50 of operating cost per case handled. Add the recovery margin target and the cross-dock premium, and the DC’s blended handling fee lands around R9–10 per case before delivery. Delivery then adds a per-drop and per-kilometre component on top (see the fee menu in Chapter 6).
| Step | Per case | Basis |
|---|---|---|
| Labour | R 3.10 | ~36% of opex ÷ 28m cases |
| Transport & fleet | R 1.93 | allocated share |
| Facility & energy | R 1.82 | rent/finance + utilities |
| Equipment, IT, security, other | R 1.65 | remaining lines |
| Total operating cost / case | R 8.50 | |
| Margin / recovery | R 1.10 | ~13% on cost |
| Blended handling fee | R 9.60 | before delivery |
Break-even: the DC’s fixed costs (facility, equipment, core staff, IT) do not fall much if volume drops, so cost-per-case rises sharply below the design throughput. If this DC ran at 60% of plan (~17m cases), the same fixed cost spreads over far fewer units and per-case cost climbs — which is exactly why under-utilised DCs destroy value. The operational lesson is blunt: a DC is a volume machine; running it part-empty is more expensive than running it full. That single fact is why retailers fight so hard to consolidate volume into fewer, fuller hubs.
What drives cost up or down? (expand for the levers)
- Temperature mix: frozen/chilled adds refrigeration capex and energy — a chilled DC can cost 2–3× more per sqm to build than ambient.
- Automation: conveyors, voice and AGVs cut labour but raise capex and IT spend; the trade-off depends on wage levels vs capital cost.
- Catchment radius: every extra kilometre to a store raises transport cost — site selection near demand clusters is decisive.
- Energy resilience: generator/solar/battery backup is now non-negotiable in SA and adds 5–15% to energy cost1516.
✦ Operations Play — Chapter 4
- Model a DC’s break-even cases/year: below it, unit cost spikes; above it, marginal cost falls — know where you sit.
- Challenge the transport line: route optimisation and load consolidation typically cut 4–8% off fleet cost.
- Separate “productive” energy from “resilience” energy in your P&L so backup-power cost is visible, not hidden in utilities.
Sample P&L & 5-Year Payback
The money: a captive retail DC usually runs as a cost-recovery operation (low single-digit EBITDA) — its real return is captured system-wide as lower delivered cost, fewer stockouts and less spoilage. Below: a synthetic P&L, then a 5-year payback for a medium chilled DC.
Illustrative DC P&L (synthetic)
Figures in R millions per year. Synthetic example for a medium multi-temperature DC (~30,000 sqm, ~28m cases/yr). Recalibrate to client.| Line | R m / yr | Note |
|---|---|---|
| Per-case distribution fees (charged to stores) | 168.0 | Primary recovery mechanism |
| Cross-dock / flow-through handling fees | 39.0 | Fresh & fast-moving lines |
| Supplier services (slotting, co-pack) | 24.0 | See Chapter 8 |
| Ancillary (returns, recycling rebate, 3PL overflow) | 17.0 | Third-party throughput |
| Total throughput revenue | 248.0 | |
| Labour | (86.0) | ~35% of opex |
| Transport & fleet | (54.0) | Fuel, tractors, trailers, maintenance |
| Facility rent / finance | (29.0) | Capex amortisation + lease |
| Utilities & energy (incl. generator diesel) | (22.0) | Refrigeration-led |
| Equipment amortisation & maintenance | (18.0) | MHE, racking, conveyors |
| IT / WMS / voice / data | (8.5) | |
| Security & risk | (7.5) | |
| Consumables, insurance, waste, other | (13.0) | |
| Total operating expenses | (238.0) | |
| EBITDA | 10.0 | ~4.0% margin — typical cost-recovery |
| Depreciation & amortisation | (22.0) | |
| Net finance / interest | (11.0) | |
| Pre-tax result | (23.0) | Book loss is expected for a captive DC |
Illustrative 5-year payback — medium chilled DC
Capex: R720m (refrigeration, insulated panels, dock seals, specialised racking, backup power). Net annual benefit = avoided DSD cost + handling revenue + spoilage reduction, less opex. R millions.| Year | Net benefit | Cumulative | % of capex recovered | Payback signal |
|---|---|---|---|---|
| 0 (build) | (720.0) | (720.0) | 0% | Capex outlay |
| 1 | 95.0 | (625.0) | 13% | Ramp-up |
| 2 | 118.0 | (507.0) | 30% | Volume matures |
| 3 | 132.0 | (375.0) | 48% | Steady-state |
| 4 | 141.0 | (234.0) | 67% | Optimisation |
| 5 | 148.0 | (86.0) | 88% | Near break-even |
| 6 | 150.0 | 64.0 | 109% | ✓ Payback (~5.6 yrs) |
Reading the result: a medium chilled DC pays back in roughly 5–6 years in this synthetic model. Ambient DCs (no refrigeration) typically pay back faster — around 3–4 years — because capex is far lower. Highly automated or fresh-meat-processing centres take longer, often 7–10 years, unless co-funding from suppliers shortens it.
Adapting these figures to a specific country / province cost base
To re-baseline this model to a target region, adjust four levers and let the rest follow:
- Labour rate: replace the wage assumption with local cost-per-head per shift; labour is 33–38% of opex, so this moves the P&L fastest.
- Energy tariff: set the local R/kWh and diesel price; for SA, factor loadshedding backup cost (generators run at ~5× grid cost15).
- Land & rent: provincial land/rent per sqm sets the facility finance line.
- Freight distance: average km to a store drives the transport line — rural networks cost more per case.
As a rule of thumb: hold throughput constant, swap these four inputs, and the P&L and payback recompute coherently. Always label the output illustrative until verified against real tenders.
✦ Operations Play — Chapter 5
- Present DC investment as system ROI, not standalone EBITDA — the avoided-cost line is where the case is won.
- Stress-test payback against a +15% energy and +20% security-cost shock; if it still pays back under 8 years, it is robust.
- Negotiate supplier co-funding (slotting/co-pack) to pull the payback year forward.
How DCs Pay for Themselves
The funding model: a DC “pays for itself” through five reinforcing levers — distribution fees, supplier contributions, scale economies, cross-dock savings, and centralised procurement power. Rarely does one lever carry the whole load; the business case is the stack.
The five commercial levers
| Lever | How it works | Typical effect |
|---|---|---|
| Distribution fees | Stores (or the group) pay a per-case / per-pallet handling & delivery fee | Recovers 40–60% of operating cost |
| Supplier contributions | Slotting fees, delivery-window premiums, co-funding, co-pack revenue | 5–15% of throughput revenue |
| Scale economies | Full-truckload inbound, lower unit handling, shared fixed cost over more volume | Per-case cost falls as volume rises |
| Cross-dock savings | Fresh/fast lines skip storage — less labour, less spoilage, faster cycle | Cuts fresh-line handling cost materially |
| Centralised procurement | One national deal replaces many store-level negotiations | Lower cost-of-goods flows to every store |
Example fee structures (illustrative)
| Fee type | Illustrative rate | Charged to |
|---|---|---|
| Ambient case handling | R 0.85 / case | Store / group |
| Chilled case handling | R 1.40 / case | Store / group |
| Frozen case handling | R 2.10 / case | Store / group |
| Delivery (per drop, per km band) | R 350 + R 9/km | Store / group |
| Slotting fee (new line listing) | R 8,000–25,000 / SKU | Supplier |
| Cross-dock / flow-through | R 0.55 / case | Supplier or store |
| Energy / resilience surcharge | 5–15% on handling | Store / supplier16 |
✦ Operations Play — Chapter 6
- Quantify avoided DSD cost (trucks/week, receiving hours, damage rate) — it is the strongest argument for the model.
- Price a transparent fee schedule: per-case by temperature, per-drop, per-km. Predictability beats lowest price.
- Ring-fence supplier contributions (slotting/co-pack) to fund capex payback, not day-to-day opex.
Stores, Systems & Integration
The nervous system: a store order is rarely typed by hand anymore. It is generated from POSPoint of Sale: the in-store till system that records every sale; its sell-through data feeds replenishment and forecasting. sell-through and demand forecasts, pushed to the WMS over EDI/FTP or an API, fulfilled by the DC, and confirmed back to the store on receipt.
How a store order is created
- POS signals: every scan at the till updates store inventory. When stock hits a reorder point, a replenishment need is raised.
- Demand forecast feed: a forecasting engine adjusts the order for day-of-week, promotions, seasonality and weather.
- Order creation: the replenishment engine builds the order and transmits it to the DC via EDIElectronic Data Interchange: standardised B2B messages (e.g. orders, ASN advance-ship notices, invoices) exchanged between systems., SFTPSecure File Transfer Protocol: an encrypted file drop used to exchange batched order/inventory files between trading partners. file drop, or a real-time APIApplication Programming Interface: a way for two systems to talk in real time over the web, exchanging small structured requests and responses. call.
- DC fulfilment: the WMS converts the order into picks; the WCS orchestrates conveyors/equipment; the TMS plans the route.
- Store receiving: an ASNAdvance Ship Notice: an electronic message telling the receiver exactly what is on the truck, before it arrives — enabling fast, accurate check-in. tells the store what is coming; the store scans it in and reconciles.
How forecasting & replenishment actually work
Behind every auto-generated store order is a forecast. Modern demand-planning engines do not simply repeat last week’s sales — they combine historical sell-through with a stack of adjustment factors: day-of-week and day-of-month patterns, public holidays and pay-week effects, planned promotions and price changes, seasonality, and increasingly external signals such as weather and local events. The output is a predicted demand curve per SKU per store, usually looking a few days to a few weeks ahead.
The replenishment engineReplenishment engine: software that turns demand forecasts plus live POS/stock data into specific order quantities, automatically creating purchase orders for the DC. sits on top of that forecast. For each SKU it compares predicted demand against current on-hand stock, stock already on order, supplier lead times, and a safety-stock buffer. When projected stock is due to fall below the safety level inside the replenishment window, the engine raises an order line — sized to the case-pack or pallet multiple — and bundles many lines into a single store order. The result is “just-in-time” ordering rather than “just-in-case” ordering: stores hold less buffer stock because the system is trusted to top them up before they run dry.
Where this goes wrong is usually a data problem, not a maths one. If the forecast is fed stale POS data, wrong promotional flags, or a broken master-data record (a wrong case-pack, a discontinued code still listed), the engine will confidently order the wrong quantity. That is why master data managementMaster Data Management (MDM): the discipline of keeping shared core data — product dimensions, case-packs, barcodes, supplier records — accurate and consistent across every system that uses it. and clean promotional data are prerequisites, not nice-to-haves. A store that overrides auto-replenishment constantly is usually signalling a data-quality issue upstream, and the fix is rarely more manual ordering — it is fixing the forecast inputs.
Order & planogram flow (text version)
Supplier → DC (inbound) → WMS / WCS → Cross-dock / Replenishment → Store order → Store receiving
Which protocol when? (EDI vs SFTP vs API)
- EDI: the retail default for high-volume, standardised messages (orders, ASNs, invoices). Reliable, batched, well-understood.
- SFTP: cheap, encrypted batch file drop — common for smaller suppliers and nightly inventory extracts.
- API: real-time, event-driven — used for live stock availability, on-demand (dark store) orders, and dynamic pricing.
Most groups run all three: EDI for the core, SFTP for the long tail of suppliers, and APIs where speed matters.
✦ Operations Play — Chapter 7
- Confirm whether your store orders are auto-replenished or manual — manual lines are where stockouts hide.
- Make sure you receive an ASN for every delivery; it halves receiving time and improves accuracy.
- Keep your planogram version current with HQ — stale fixtures cause phantom out-of-stocks and wrong facings.
Supplier Engagement
Who pays, who delivers: suppliers fund DCs through slotting fees, delivery-window premiums, co-funding and co-packing. Goods arrive either direct-to-store (DSD) or via the DC. The split is a commercial decision per category, not a technical one.
How suppliers support the DC
| Mechanism | What it is | Who benefits |
|---|---|---|
| Slotting fees | One-off charge to list a new SKU / secure shelf & pick-face space | DC (capex recovery) |
| Delivery-window premiums | Priority or off-peak appointment slots at receiving | DC (throughput smoothing) |
| Co-funding | Supplier contributes to equipment, racking or automation tied to their volume | Both — payback pulled forward |
| Co-packing / value-add | DC performs repacking, multipacks, labelling, kitting on supplier’s behalf | Supplier (saves capex) + DC (revenue) |
| Promotional co-op | Shared funding of promo volume handling | Both |
DSD vs DC delivery — the trade-off
| Dimension | Direct Store Delivery | DC delivery |
|---|---|---|
| Best for | Fresh, short-life, local, promotional (bread, milk, soft drinks) | Volume ambient, frozen, slow-movers, national brands |
| Supplier control | High — owns the shelf & merchandising | Lower — DC ranges and sequences |
| Cost to store | Hidden in list price; heavy on receiving | Transparent fee; low receiving load |
| Freshness | Excellent for same-day categories | Good, but adds a handling step |
| Barrier for small supplier | Low — can deliver one store | High — must meet volume & appointment discipline |
Common supplier SLAs (illustrative)
| SLA element | Illustrative target |
|---|---|
| On-time delivery (to appointment) | ≥ 96% |
| In-full (no short ships) | ≥ 98% |
| OTIF combined | ≥ 95% |
| Lead time (order → delivery) | 24–72 h by category |
| Damage / rejected-on-receipt | ≤ 0.5% |
| Chargebacks for non-compliance | Per incident, escalating |
✦ Operations Play — Chapter 8
- Negotiate OTIF SLAs with measurable targets and chargeback teeth — soft SLAs are free failures.
- Keep a short, defended list of DSD partners for fresh/local lines the DC will not range.
- Use slotting/co-pack conversations to co-fund automation rather than just paying listing fees.
Distribution Centre Types
Not all DCs are equal: a dry-goods shed and a fresh-meat processing centre share a name but almost nothing else. Each type has distinct infrastructure needs (HACCPHazard Analysis and Critical Control Points: a food-safety management system identifying and controlling biological, chemical and physical hazards across the chain., GMPGood Manufacturing Practice: minimum standards for hygiene, process and documentation in food/production facilities., plant access, specialised racking), cost drivers and throughput profiles.
| DC type | Temp | Key infrastructure | Cost driver | Throughput note |
|---|---|---|---|---|
| Dry goods / general merchandise | Ambient | High-bay racking, wide aisles, MHE | Floor space, labour | Highest case volume; lowest unit cost |
| Ambient groceries | 15–25 °C | Racking, voice pick, cross-dock bays | Labour, transport | Backbone of any grocery DC network |
| Frozen / cold chain | ≤ −18 °C | Insulated panels, dock seals, blast freezing, backup power | Energy, capex | 2–3× ambient capex per sqm |
| Chilled / multi-temp | 0–5 °C | Refrigerated chambers, ante-rooms, temp locks | Energy, speed | Dairy, meat, deli, prepared meals |
| Fresh produce | Varied | Ripening rooms, grading, HACCP, wash-down areas | Shrink/spoilage | Fast flow-through; high waste % |
| Fresh meat / poultry processing | ≤ 4 °C | Processing plant, GMP, cold chain, sanitation | Plant & compliance | Value-add: cut, pack, date-code |
| Fish / seafood cold chain | −1 to 2 °C | Ice/brine, super-chilling, ultra-tight temp control | Compliance, shrink | Shortest shelf life; premium risk |
| Co-packing / private-label centre | Mixed | Packing lines, labelling, kitting, QC | Labour, line capex | Margin engine: house-brand value-add |
Handling notes for fresh & perishable DCs
The further a DC sits toward fresh and perishable, the more its economics are governed by shrink (lost stock to spoilage) rather than by throughput alone. Fresh produce centres add ripening rooms (bananas, avocados), grading and quality lines, and wash-down hygiene zones; their waste percentage runs far higher than ambient, and a single delayed truck can turn a day’s perishable intake into write-off. Meat and poultry processing centres are part warehouse, part factory: they receive carcasses or primal cuts, break them down, portion, tray-pack, gas-flush or vacuum-seal, apply date codes, and dispatch under continuous chilling — all under GMP and HACCP controls with sanitation cycles built into the shift. Fish and seafood cold chains are the tightest of all, often relying on ice or brine and super-chilling to stretch a shelf life measured in hours, not days.
The commercial implication: perishable DCs cannot be run as pure cost centres the way ambient sheds can. Their value is measured in freshness delivered and spoilage avoided, and they are typically located as close to the demand cluster as possible to shrink transit time. For a store owner, this is why your fresh delivery’s arrival temperature and remaining shelf life matter more than the invoice price — a cheaper pallet that loses a day of life costs more in the end.
What changes between an ambient and a frozen DC? (expand)
- Capex: insulated envelope, refrigeration plant, dock seals and backup generation push frozen capex to multiples of ambient.
- Energy: refrigeration can be 50–70% of a cold-site’s electricity bill; every degree of warming avoided is money saved.
- Discipline: dock doors must seal instantly, doors stay closed, and product moves fast — a single propped door can compromise a chamber.
- Compliance: cold and fresh sites carry HACCP/GMP audit load ambient sites do not.
✦ Operations Play — Chapter 9
- Match the DC type to the category’s shelf life — over-chilling ambient goods wastes energy; under-chilling fresh risks lives.
- For any cold/fresh site, prioritise backup power and door-seal discipline before automation — they prevent catastrophic loss.
- Use a co-pack/private-label line to lift margin on house brands rather than adding pure handling volume.
Technology Stack & Integrations
The stack: a modern DC runs on a family of specialised systems — WMS, WCS, TMS, ERP, demand forecasting, planogram tools, replenishment engines, and EDI/API gateways — joined by an integration layer. Below are capabilities only (no vendor names); evaluate tools against these, not against logos.
| System | Capability | What good looks like |
|---|---|---|
| WMS (Warehouse Management) | Receiving, put-away, inventory, picking, dispatch | Real-time stock accuracy > 99%; slot optimisation |
| WCS (Warehouse Control) | Orchestrates conveyors, sorters, automated equipment | Smooth hand-offs between humans & machines |
| TMS (Transport Management) | Route planning, load building, delivery scheduling | Optimised multi-drop routes; live ETA |
| ERP | Finance, procurement, master data, the system of record | Single source of truth for cost & inventory value |
| Demand forecasting | Predicts store demand from sales, promo, seasonality | Reduces both stockouts and overstock |
| Replenishment engine | Auto-generates store orders from forecasts & POS | Orders arrive “just in time”, not “just in case” |
| Planogram tools | Design & distribute shelf layouts to stores | Consistent, data-driven range & facings |
| EDI / API gateway | Exchanges orders, ASNs, invoices with partners | Real-time where it matters; batch where it doesn’t |
| Voice picking / automation | Hands-free pick instructions; AGVs, conveyors | Faster, more accurate picks; quieter floor |
How much automation makes sense? (expand)
Automation’s payback depends on the ratio of wage cost to capital cost. Where labour is relatively affordable, voice picking, route optimisation and conveyor sortation typically pay back fastest. Full robotic automation (AS/RS, shuttle systems, goods-to-person robots) is harder to justify until volumes are very high or labour markets tighten. The pragmatic path in most SA networks: automate the repetitive, error-prone steps first; keep humans on judgement and exception handling26.
✦ Operations Play — Chapter 10
- Specify requirements by capability, then evaluate vendors — never start with a brand shortlist.
- Insist on open APIs/EDI; a closed system is a future cost trap.
- Automate the boring, error-prone tasks (picking accuracy, routing) before chasing headline robotics.
Pain Points & Risk Mitigation
What breaks: loadshedding and the cold chain, cargo crime, supplier consolidation, and rigid cut-off times are the live SA pain points. Below is a risk-and-mitigation matrix plus the SA-specific numbers that make them urgent.
SA-specific risk signals (illustrative, to be verified)
- Loadshedding cost: one major retailer reported a ~R200m spoilage loss in a single year14; another’s monthly generator diesel spend climbed from ~R16m to ~R150m at peak15. Cold-chain operators added 15–30% to operating cost and apply 5–15% energy surcharges16.
- Cargo crime: SAPS recorded 420 truck hijackings in Q2 2025 alone17; over 18 months to mid-2022, ~2,670 incidents and ~R577m in losses were logged across all provinces17. The logistics “security tax” rose from ~0.3% to ~2.3% of operating cost (up to ~4.1% for high-value goods)19.
- Cold-chain physics: roughly +1 °C per ~10 minutes outside the chain13; chilled > 5 °C or frozen > −18 °C = compromised.
Risk & mitigation matrix
| Risk | Likelihood | Impact | Mitigation |
|---|---|---|---|
| Cold-chain failure / power loss | High | Severe | Redundant refrigeration, generator + solar/battery, temp alarms, IoT monitoring, door-seal discipline |
| Cargo theft / hijacking | High | Severe | Route variation, armed escorts/convoy, real-time tracking, anti-jamming, vetted drivers, no fixed schedule leaks |
| Loadshedding | High | High | Backup power sized for full load, solar + storage, demand-side management, schedule-aligned ops |
| Labour strike / unrest | Med | Severe | Cross-trained staff, contingency roster, safety stock buffer, secure site access |
| System outage (WMS/ERP down) | Low–Med | Severe | Failover/HA, tested DR, paper-based fallback procedures, offline picking mode |
| Stock obsolescence / expiry | Med | Med | FEFO enforcement, demand sensing, markdown engine, tight promo planning |
| Transport disruption (breakdown, port, road) | Med | High | Spare fleet capacity, multiple carriers, buffer stock at distant stores, contingency routing |
✦ Operations Play — Chapter 11
- Test backup power under full load this month, not next — and align shifts to the loadshedding schedule.
- Keep a vetted local fallback supplier for bread, milk, eggs in case a DC truck is hijacked or delayed.
- Log fridge/freezer temps every 2 hours — that log is your defence if a customer gets sick.
- Run a tabletop drill: “WMS is down for 6 hours” — can your floor still pick and dispatch on paper?
Dark Stores & the Next Decade
The next layer: on-demand grocery is the fastest-growing part of the logistics picture. A dark storeA retail-format facility closed to walk-in shoppers, optimised purely for picking and packing online orders for rapid delivery. removes the conflict between online pickers and in-store shoppers fighting for the same shelf. Expect more micro-fulfilment, automation and township reach over the next decade.
Where the numbers are going (generic, SA)
- SA online retail reached ~R71bn in 2023 and is on track to exceed ~R130bn by end-2025 — approaching ~10% of total retail25. On-demand grocery is the fastest segment within that.
- One large discounter’s sub-hour service now runs multiple dedicated dark stores and fulfils from hundreds of regular stores turned into micro-fulfilment nodes; that one service alone grew revenue by ~35% in a recent half-year and now represents roughly a tenth of group sales21.
- A premium grocer’s on-demand app grew ~70% year-on-year and is adding more dark stores2223; a value retailer’s online business grew nearly 50% and is now profitable on a fully-costed basis24.
- Estimates put an untapped township economy on the order of ~R900bn25 — both a threat (more competition) and an opportunity (better supply access than ever).
What this means inside the DC and on your floor
- Automation creeps in: conveyor sortation and automated guided vehicles move totes; IoT sensors flag the moment a truck’s temperature drifts26.
- Labour still dominates: because local wages are lower than in Europe/US, full automation is hard to justify — but voice picking, route optimisation and WMS are already standard.
- Your store may become a node: staff could be asked to pick online orders from your shelves while serving walk-in customers — plan dedicated pickers and clear processes.
- Resilience goes green: solar + battery backup at DCs to cut diesel dependence is the coming default.
✦ Operations Play — Chapter 12
- If your group launches online fulfilment from your store, secure dedicated pick staff and a staging area before go-live.
- Identify whether a dark store is planned in your catchment — it changes your online opportunity and your walk-in risk.
- For independents in townships: build the local-list relationships now, before chain on-demand arrives.
Practical Playbooks by Role
Expand the panel for your role. Each is a short, actionable checklist you can act on this week.
For franchisee supermarket owners
- Your franchise agreement likely forces most stock through the franchisor’s DC — know your receiving windows and build the roster around them.
- Invest in backup power; if the DC truck arrives during loadshedding and your cold room is down, you lose stock before you sell it.
- Chase shortage/damage credits like a hawk — the DC handles thousands of cases; do not sign until you have checked.
- Prepare for online fulfilment: dedicated pickers, clear processes, so floor staff aren’t fighting pickers for the last loaf.
For independent supermarket owners
- If you’re not tied to a chain DC, consider a buying group / voluntary chain to get DC pricing without full franchise control.
- Your edge is flexibility: stock the local products the big chains ignore — bakeries, butcheries, produce suppliers who can’t supply a mega-DC.
- Watch transport cost: every kilometre to a wholesaler eats margin. Consolidate collection runs.
For store managers
- Train receiving staff to catch short dates, damage and temperature breaches before they hit the shelf.
- Keep the cold chain intact: log fridge/freezer temps every 2 hours. That log is your defence.
- Plan for late deliveries: have a local fallback for bread, milk and eggs if the DC truck is hijacked or breaks down.
For area managers
- Track DC service level by region; if one DC is consistently late or short, escalate it.
- Share crime intelligence: if hijackings rise on a route, push for route changes, escorts or earlier delivery times.
- Keep every store current on the loadshedding schedule; confirm generators were tested this week.
For cash-and-carry operators
- Your customers collect, but your own receiving faces the same DC risks if you buy from chain DCs or importers.
- Decide whether on-demand/dark-store fulfilment is a threat or an opportunity — could you serve spaza shops before the chains do?
For family-owned supermarket businesses
- The next generation must understand logistics, not just the shop floor. Your edge is now knowing your supply chain by the numbers.
- If selling or franchising, business value is tied to DC integration — clean receiving records, low wastage and good DC relationships add real value.
Glossary, References & Developer Notes
Glossary
| Term | Meaning |
|---|---|
| DC | Distribution Centre — central warehouse that receives bulk and redistributes mixed, store-ready loads. |
| DSD | Direct Store Delivery — supplier delivers straight to each store. |
| Cross-dock / flow-through | Goods move inbound-to-outbound with little/no storage. |
| WMS / WCS | Warehouse Management / Control System — runs and orchestrates DC operations. |
| TMS | Transport Management System — route planning, load building, scheduling. |
| ERP | Enterprise Resource Planning — finance, procurement, master data, system of record. |
| EDI / SFTP / API | B2B message exchange methods (standard messages / encrypted file drop / real-time calls). |
| ASN | Advance Ship Notice — tells the receiver what’s on the truck before it arrives. |
| POS | Point of Sale — the till; sell-through data feeds replenishment. |
| MHE | Material Handling Equipment — forklifts, reach trucks, conveyors, AGVs. |
| FEFO / FIFO | First-Expired / First-In-First-Out stock rotation. |
| HACCP / GMP | Food-safety management / Good Manufacturing Practice standards. |
| SLA / OTIF | Service-Level Agreement / On-Time-In-Full delivery metric. |
| Slotting fee | Charge to list a SKU / secure pick-face space. |
| EBITDA / Capex / Opex / ROI | Earnings before interest, tax, D&A / capital expenditure / operating expense / return on investment. |
| Dark store / micro-fulfilment | Shopper-free pick facility / small-format fulfilment node. |
| SKU | Stock-Keeping Unit — a unique sellable product line. |
References
Every citation in this playbook is a live link to its source. Hover a number in the text to see the source; click to open it.
| # | Source |
|---|---|
| 1 | Leader.co.za — retailer history: why a late move to central distribution was costly |
| 4 | IOL Business Report — a major retailer phases in centralised distribution (2007) |
| 5 | Supply Chain Nuggets — flagship inland DC: build cost, footprint, stores served |
| 6 | Safal Steel — largest single-roof distribution centre on the continent |
| 7 | News24 Fin24 — inside a mega-DC: consolidation, sections, employment scale |
| 8 | Supermarket.co.za — DC operations: dock doors, product/supplier counts, voice picking |
| 10 | The Spar Group — regional grocery DC network & satellite hubs (PDF) |
| 12 | WBHO — dock-leveler count at a large inland DC |
| 13 | Shipping & Freight Resource — cold-chain temperature rise outside the chain |
| 14 | EcoFlow — retailer spoilage loss attributed to loadshedding |
| 15 | M&G Investments — generator diesel spend trend; generator vs grid cost multiple |
| 16 | Cold Chain SA — cold-chain operating-cost increase & energy surcharges |
| 17 | Logistics Business Africa — truck hijacking & cargo-theft statistics (SAPS / industry) |
| 19 | Channelwise — the logistics ‘security tax’ trend over time |
| 20 | Wiley Online Library — small-supplier disadvantage & distance from a DC |
| 21 | MyBroadband — sub-hour on-demand service: dark stores, growth, % of group sales |
| 22 | Business Day — premium grocer dark-store expansion |
| 23 | Centro Property Solutions — premium grocer on-demand app growth |
| 24 | Daily Investor — value retailer online growth & profitability |
| 25 | OpenPR / IMARC — SA online-retail size/growth; untapped township economy |
| 26 | ITWeb — automation & labour in smart warehouses |